The deepest analytics of any cube timer
Most timers show you a line going down and leave you to it. Flowtimer answers the real questions. Are your bad solves getting better? Do you cube worse after 11pm? Did that new method actually help?
Every chart shares one filter, so a question you ask once applies everywhere.
Percentiles
Your average is hiding the thing you should fix
Two cubers with the same Ao100 can have completely opposite problems. One is slow but consistent, the other is fast with a tail of disasters. Only one of them should be drilling PLL, and your average will never tell you which.
See your real bad day
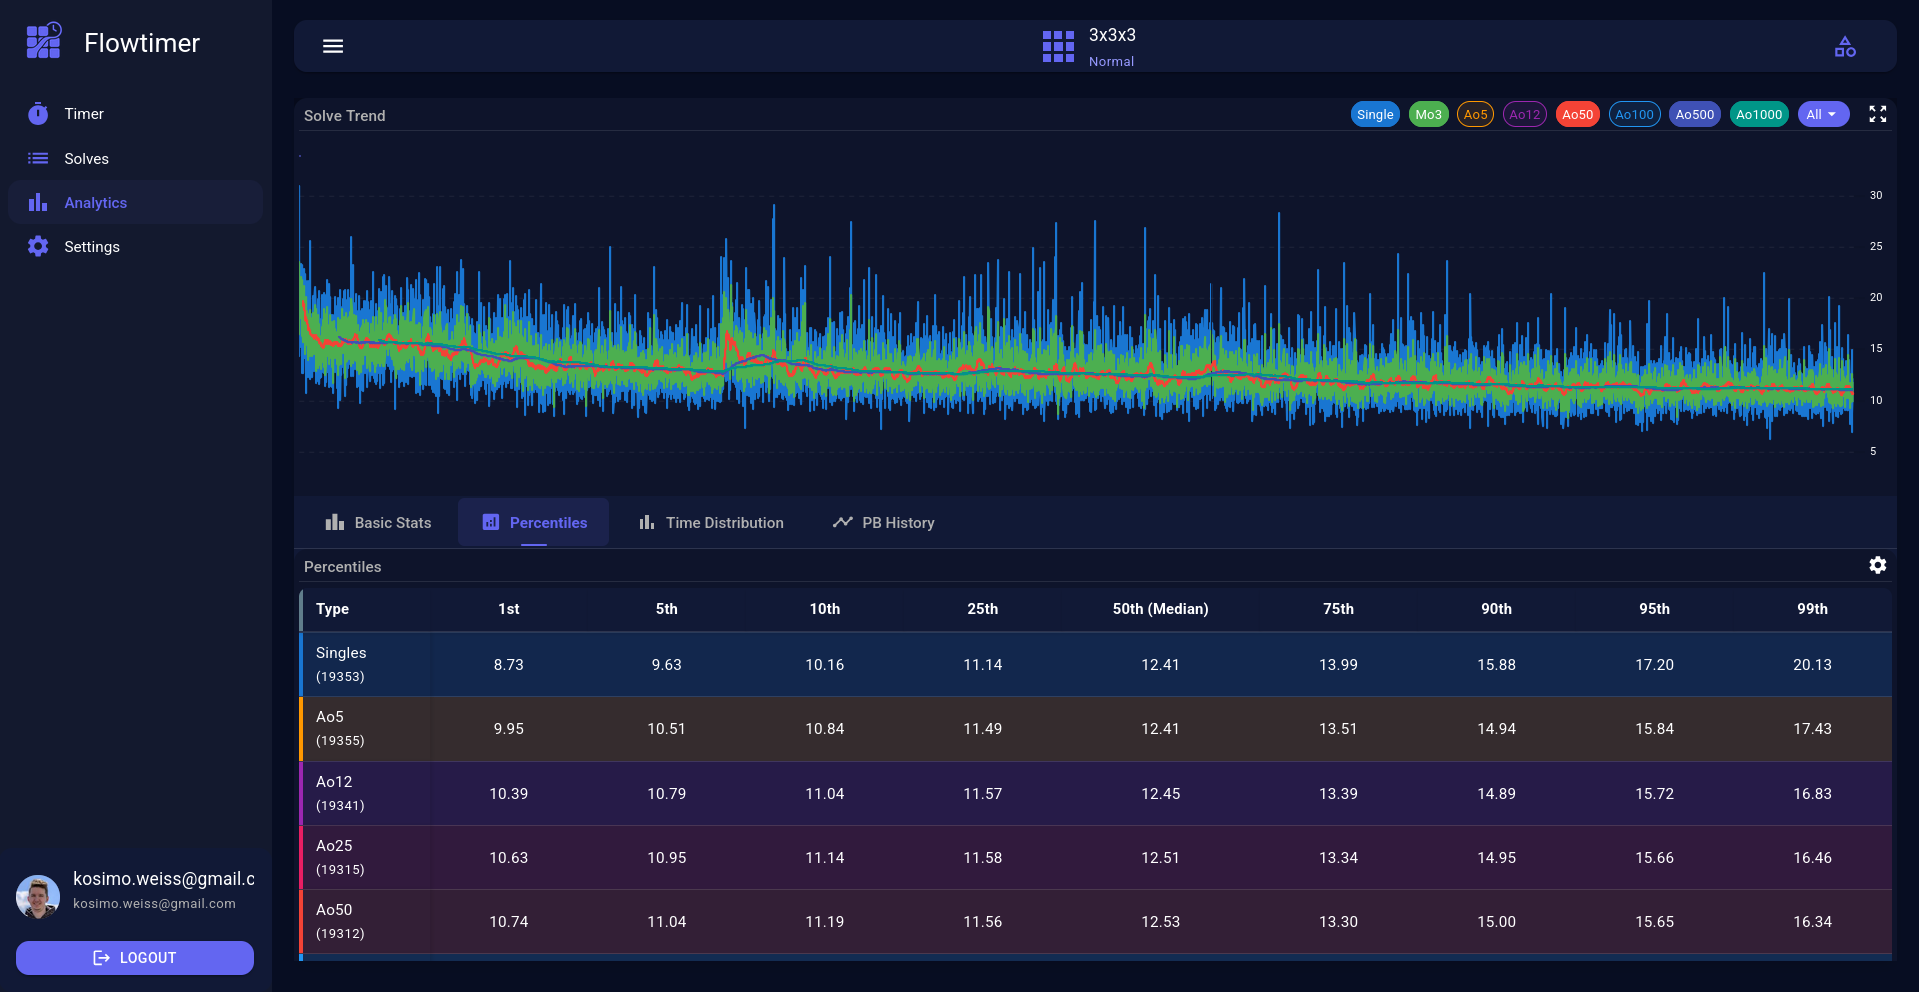
The 95th percentile is the solve you get when it goes wrong, and it improves for completely different reasons than your average. Flowtimer gives you the 1st through 99th for singles and every average length, side by side.
Set a target you can actually chase
"Get faster" is not a goal. "70% of my solves under 12 seconds" is. Set your own thresholds and watch the number climb.
Charts
Nine ways to slice your solves
Every chart reads from the same filter, so narrowing to "3x3, last 60 days" narrows the whole page at once.
Solve trend
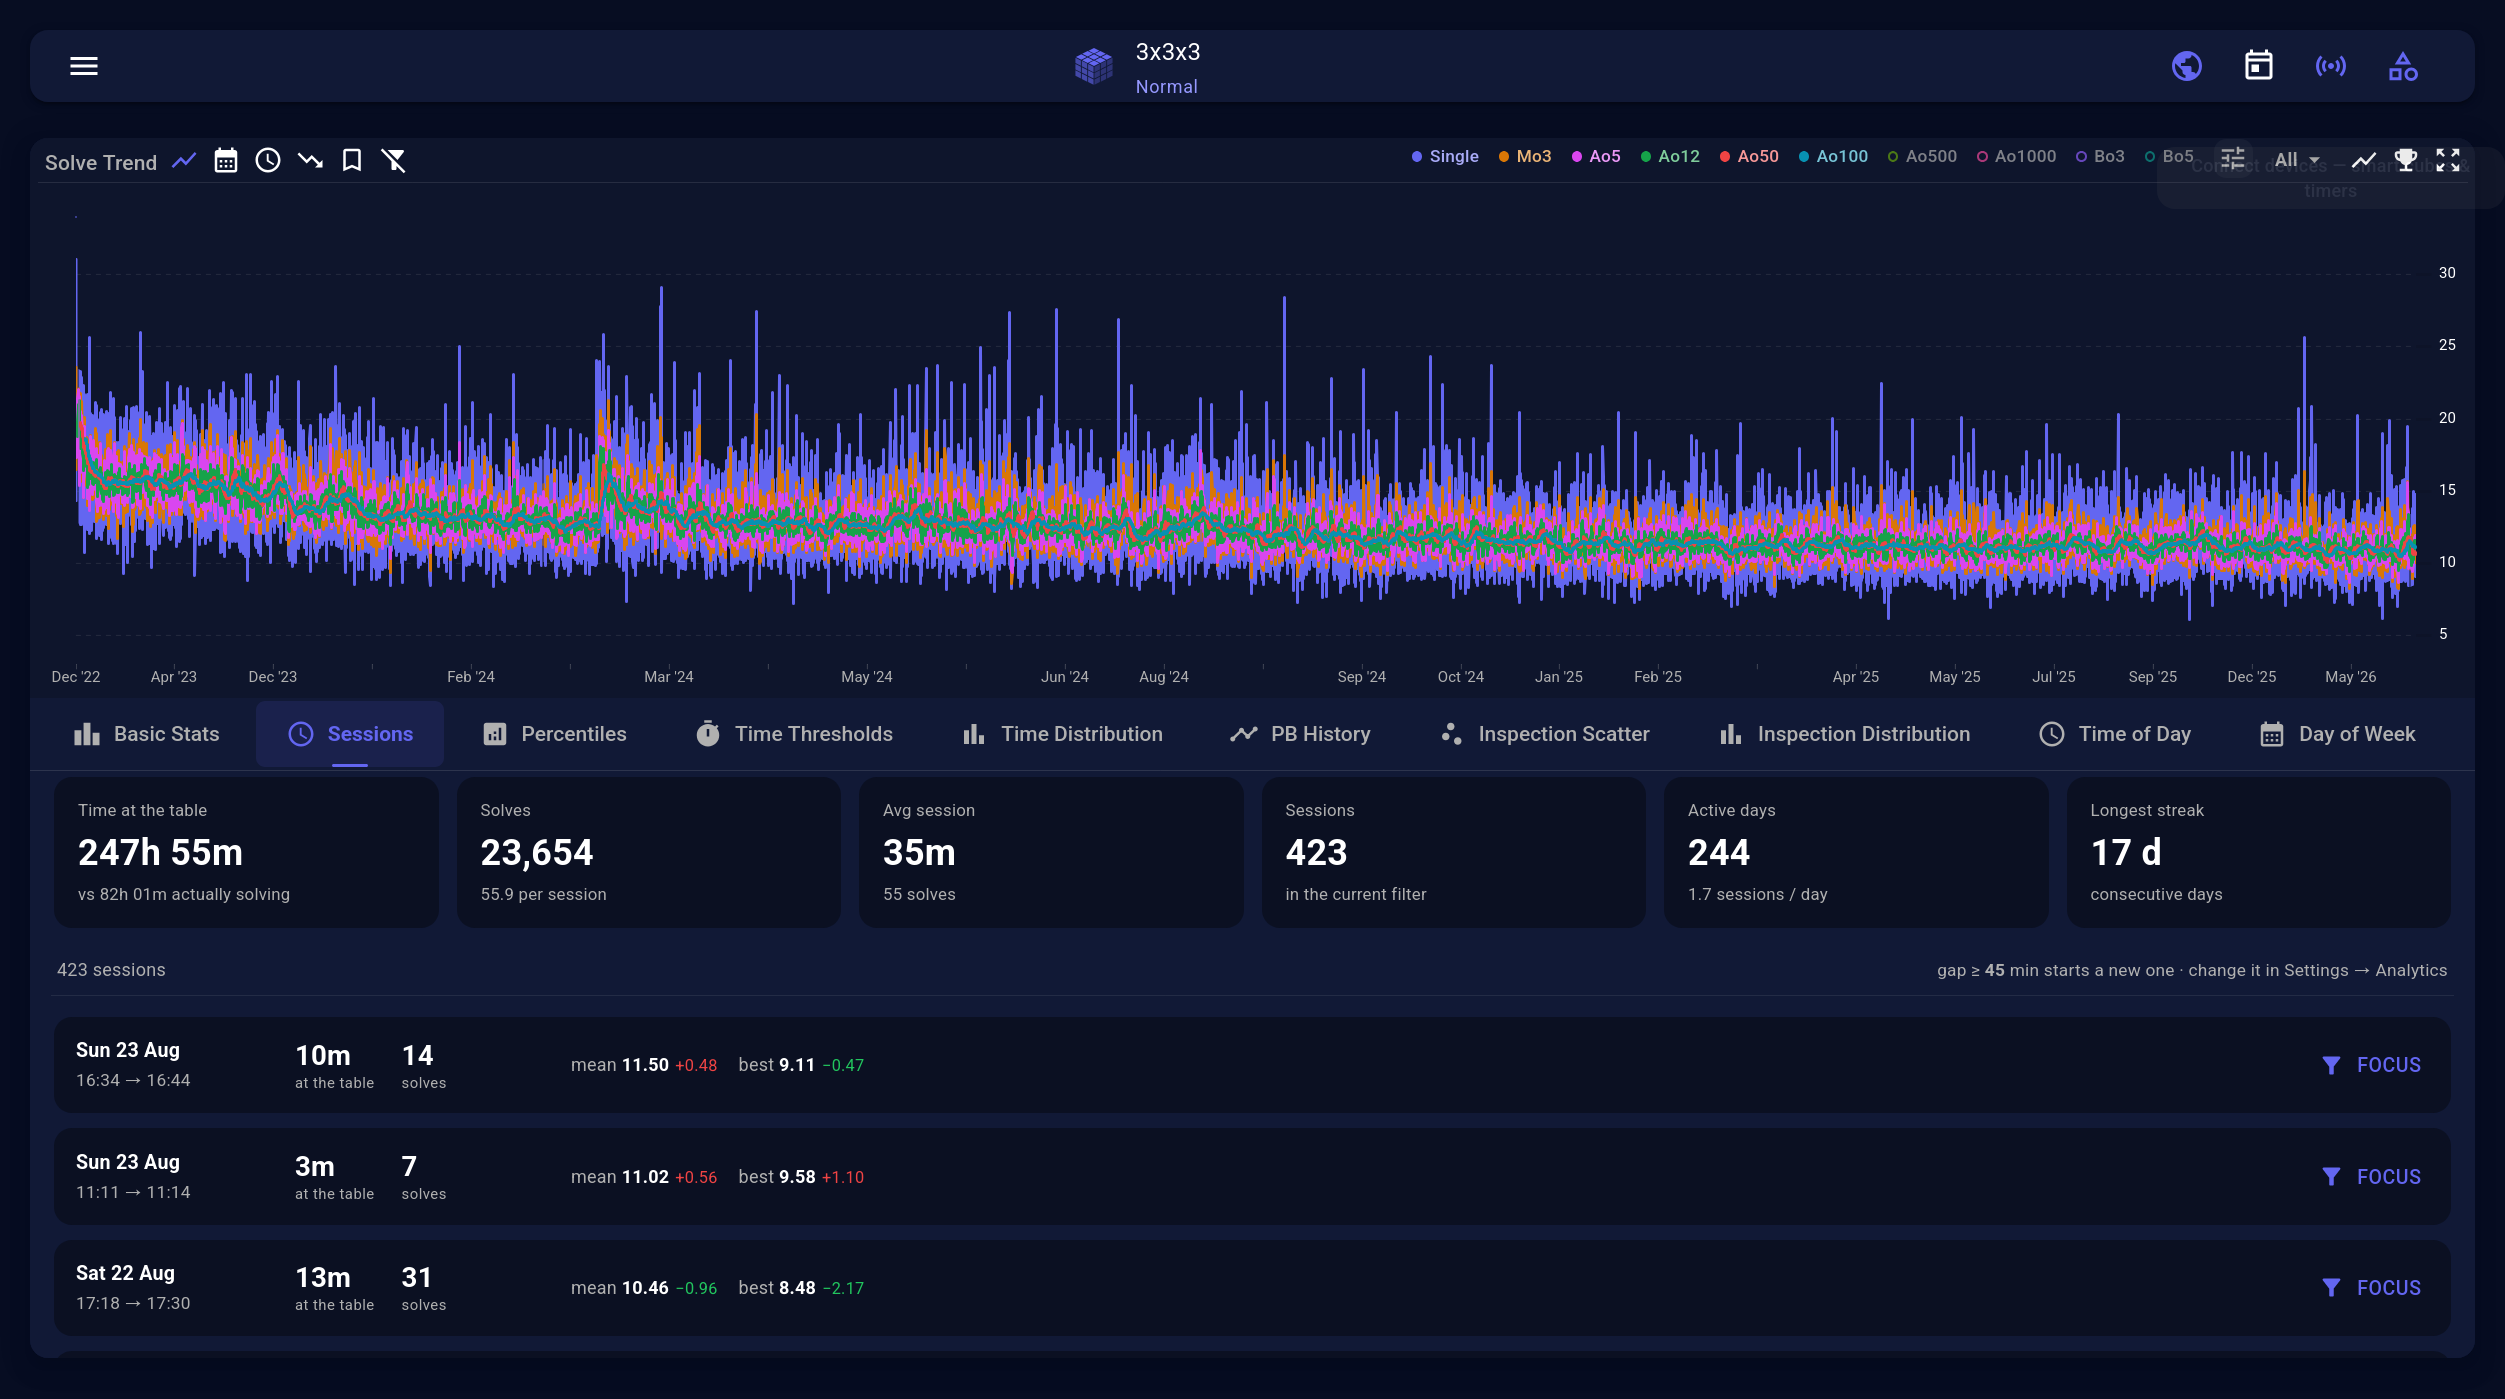
Singles and every average length on a real date axis, with personal bests marked. Zoom into a range and the rest of the page follows.
Percentiles
The 1st through 99th percentile for singles, Ao5, Ao12, Ao25, Ao50 and up. This is where consistency shows itself.
Time distribution
The histogram of your solves. A long right tail means the problem is disasters, not speed.
PB history
Every personal best with the date it was set and how long it survived.
Time of day
Solve time against the hour you did it. Most people are surprised by this one.
Day of week
The same idea across the week, plus a calendar heatmap of how much you actually practised.
Progress over time
Your average by week or month, so improvement reads as a step rather than noise.
Inspection
How long you inspect and what it buys you. Distribution, and a scatter against solve time.
Smart cube
Move counts, turns per second and phase splits, for solves recorded with a Bluetooth cube.
Filters
Ask a question one click at a time
Click a session to filter to it, click a weekday to narrow further. Every filter is visible and undoable, so you never end up staring at a chart wondering what is even on. Found something good? Save the view.
- Every filter is visible and undoable, one step at a time.
- Saved views bring back the setups you use most, in one click.
- Zoom the trend chart and the whole page follows.
Sessions
Sessions that match how you actually practise
Flowtimer finds your real sessions from the gaps between solves, not from whatever you remembered to name. Then it shows you how long you last before you get worse, whether your first ten solves are warm-up, and which sessions were the good ones.
- You choose the gap. Twenty-minute blocks or three-hour ones, whatever you do.
- A calendar heatmap of how much you really practise.
- Full PB history, every record and exactly how long it stood.
Speed
Fast at 200 solves. Fast at 200,000.
Plenty of timers start grinding after a few thousand solves. Flowtimer caches everything it can and only recomputes what changed, so the page opens instantly no matter how much history you have.
- Nothing is ever dropped. Your first ever session is still in the charts years later.
- Comps and races stay separate from practice, so nerves never skew your training numbers.
- Hide every time on screen, charts included, for streaming or screenshots.
FAQ
Analytics questions
How many solves can Flowtimer handle?
Well past a hundred thousand. Statistics are cached and only the part that changed gets recomputed, so the page opens fast no matter how big your history is.
Can I import my history from another timer?
Yes, and you should. Import reads the common export formats, and the charts get far more interesting with a few years behind them.
What is the difference between Ao5 and Mo3?
An average of 5 drops your best and worst solve and means the middle three, which is how the WCA scores most events. A mean of 3 is just the mean of three solves, used for the longer events. Flowtimer does both, plus Ao12, Ao25, Ao50, Ao100, Ao500 and Ao1000.
Can I see statistics for one puzzle or one session?
Yes. Filters stack, so narrow by puzzle, date range, session length, weekday or any combination, and every chart follows.
Does it separate practice from competition solves?
Yes. Comp rounds and races are kept apart from practice, so a nervous comp average never distorts your training numbers.
Can I hide my times while showing someone the charts?
Yes, one toggle masks every time on screen, charts included. Handy for streaming, screenshots, or just not psyching yourself out mid-session.
Point the charts at your own solves
Import your history or start fresh. Either way the charts fill in from your first session.
Learn more